
Infrastructure monitoring
Forge provides baseline infrastructure monitoring for every deployed platform stack using CloudWatch dashboards, CloudWatch alarms, and a central SNS alerts topic. This answers a different operational question than application observability: is the platform itself healthy?
This guide is for architecture review, procurement, and technical diligence. It explains how Forge thinks about infrastructure monitoring — not how to deploy alarms or wire on-call routing. The four-concern operational model is in Observability architecture; application telemetry depth is in Application telemetry.
What problem this solves
Application observability tells you how software behaves. It does not, by itself, tell you:
- Whether the load balancer is marking targets unhealthy — ECS tasks may still be running while the target group removes them from service.
- Whether the database or cache is under pressure.
- Whether edge protection is firing — WAF blocks and CloudFront errors need infrastructure-level signals, not JVM metrics.
- Whether email reputation is degrading — bounce and complaint rates are infrastructure concerns, not HTTP request counters.
Forge provisions baseline CloudWatch dashboards and alarms so operators inherit sensible monitoring from the first deployment.
Architectural model
Forge deliberately separates infrastructure monitoring from application observability:
  AWS resources (ECS, ALB, RDS, CloudFront, …)
        │
        ▼
  CloudWatch metrics
        ├────────► CloudWatch dashboards   (per-stack operational view)
        │
        └────────► CloudWatch alarms         (threshold breaches)
                      │
                      ▼
               SNS alerts topic
                      │
                      ▼
operator routing (PagerDuty, email, chat, …)| Dimension | Infrastructure monitoring (this guide) | Application observability |
|---|---|---|
| Question | Is the infrastructure healthy? | How is my software behaving? |
| Primary backend | CloudWatch metrics | AMP, X-Ray, CloudWatch Logs, AMG |
| Typical signals | CPU, memory, 5xx, target health, WAF | Request latency, domain counters |
| Alert delivery | SNS | Operator-defined (often AMG + SNS) |
| Deploys with stage | Yes — including INT | TEST / PROD when observability on |
Each monitored stack receives its own dashboard so operators can narrow investigations to the layer that changed — runtime, datastore, edge, identity, or domain — without a single monolithic “everything” board.
Monitoring is defined alongside the stacks that own each resource. Each stack contributes dashboards and alarms for the infrastructure it provisions, so monitoring evolves with the platform rather than living in a separate, hand-maintained configuration.
How the pieces fit together
Three operational layers complement each other during an incident:
  Health checks (readiness)        →  "Should this task receive traffic?"
  Infrastructure monitoring        →  "Is the surrounding infrastructure failing?"
  Application observability        →  "Which requests, traces, or domain operations broke?"
An operator might see a target-health alarm first, confirm readiness failures in ECS, then use traces and structured logs to find the root cause. None of these replaces the others.
Monitoring coverage
Forge aligns CloudWatch alarms with the CDK stacks that own the resources. The table below describes what classes of infrastructure receive dashboards and alarms, not an exhaustive metric catalogue.
| Domain | Resources monitored (high level) | Typical alarm themes |
|---|---|---|
| Runtime | ECS Fargate services, public and internal application load balancers | Target health, 5xx rates, CPU and memory utilisation |
| Datastore | RDS, DynamoDB, S3, ElastiCache Redis replication group | Connection pressure, storage, throttling, cache health |
| Edge | CloudFront distribution, static delivery buckets; global WAF Web ACL | Origin errors, cache behaviour, blocked request spikes |
| Identity | Cognito-related Lambda functions | Error rates and throttling on identity custom resources |
| Domain | SES configuration-set reputation | Bounce and complaint rate thresholds |
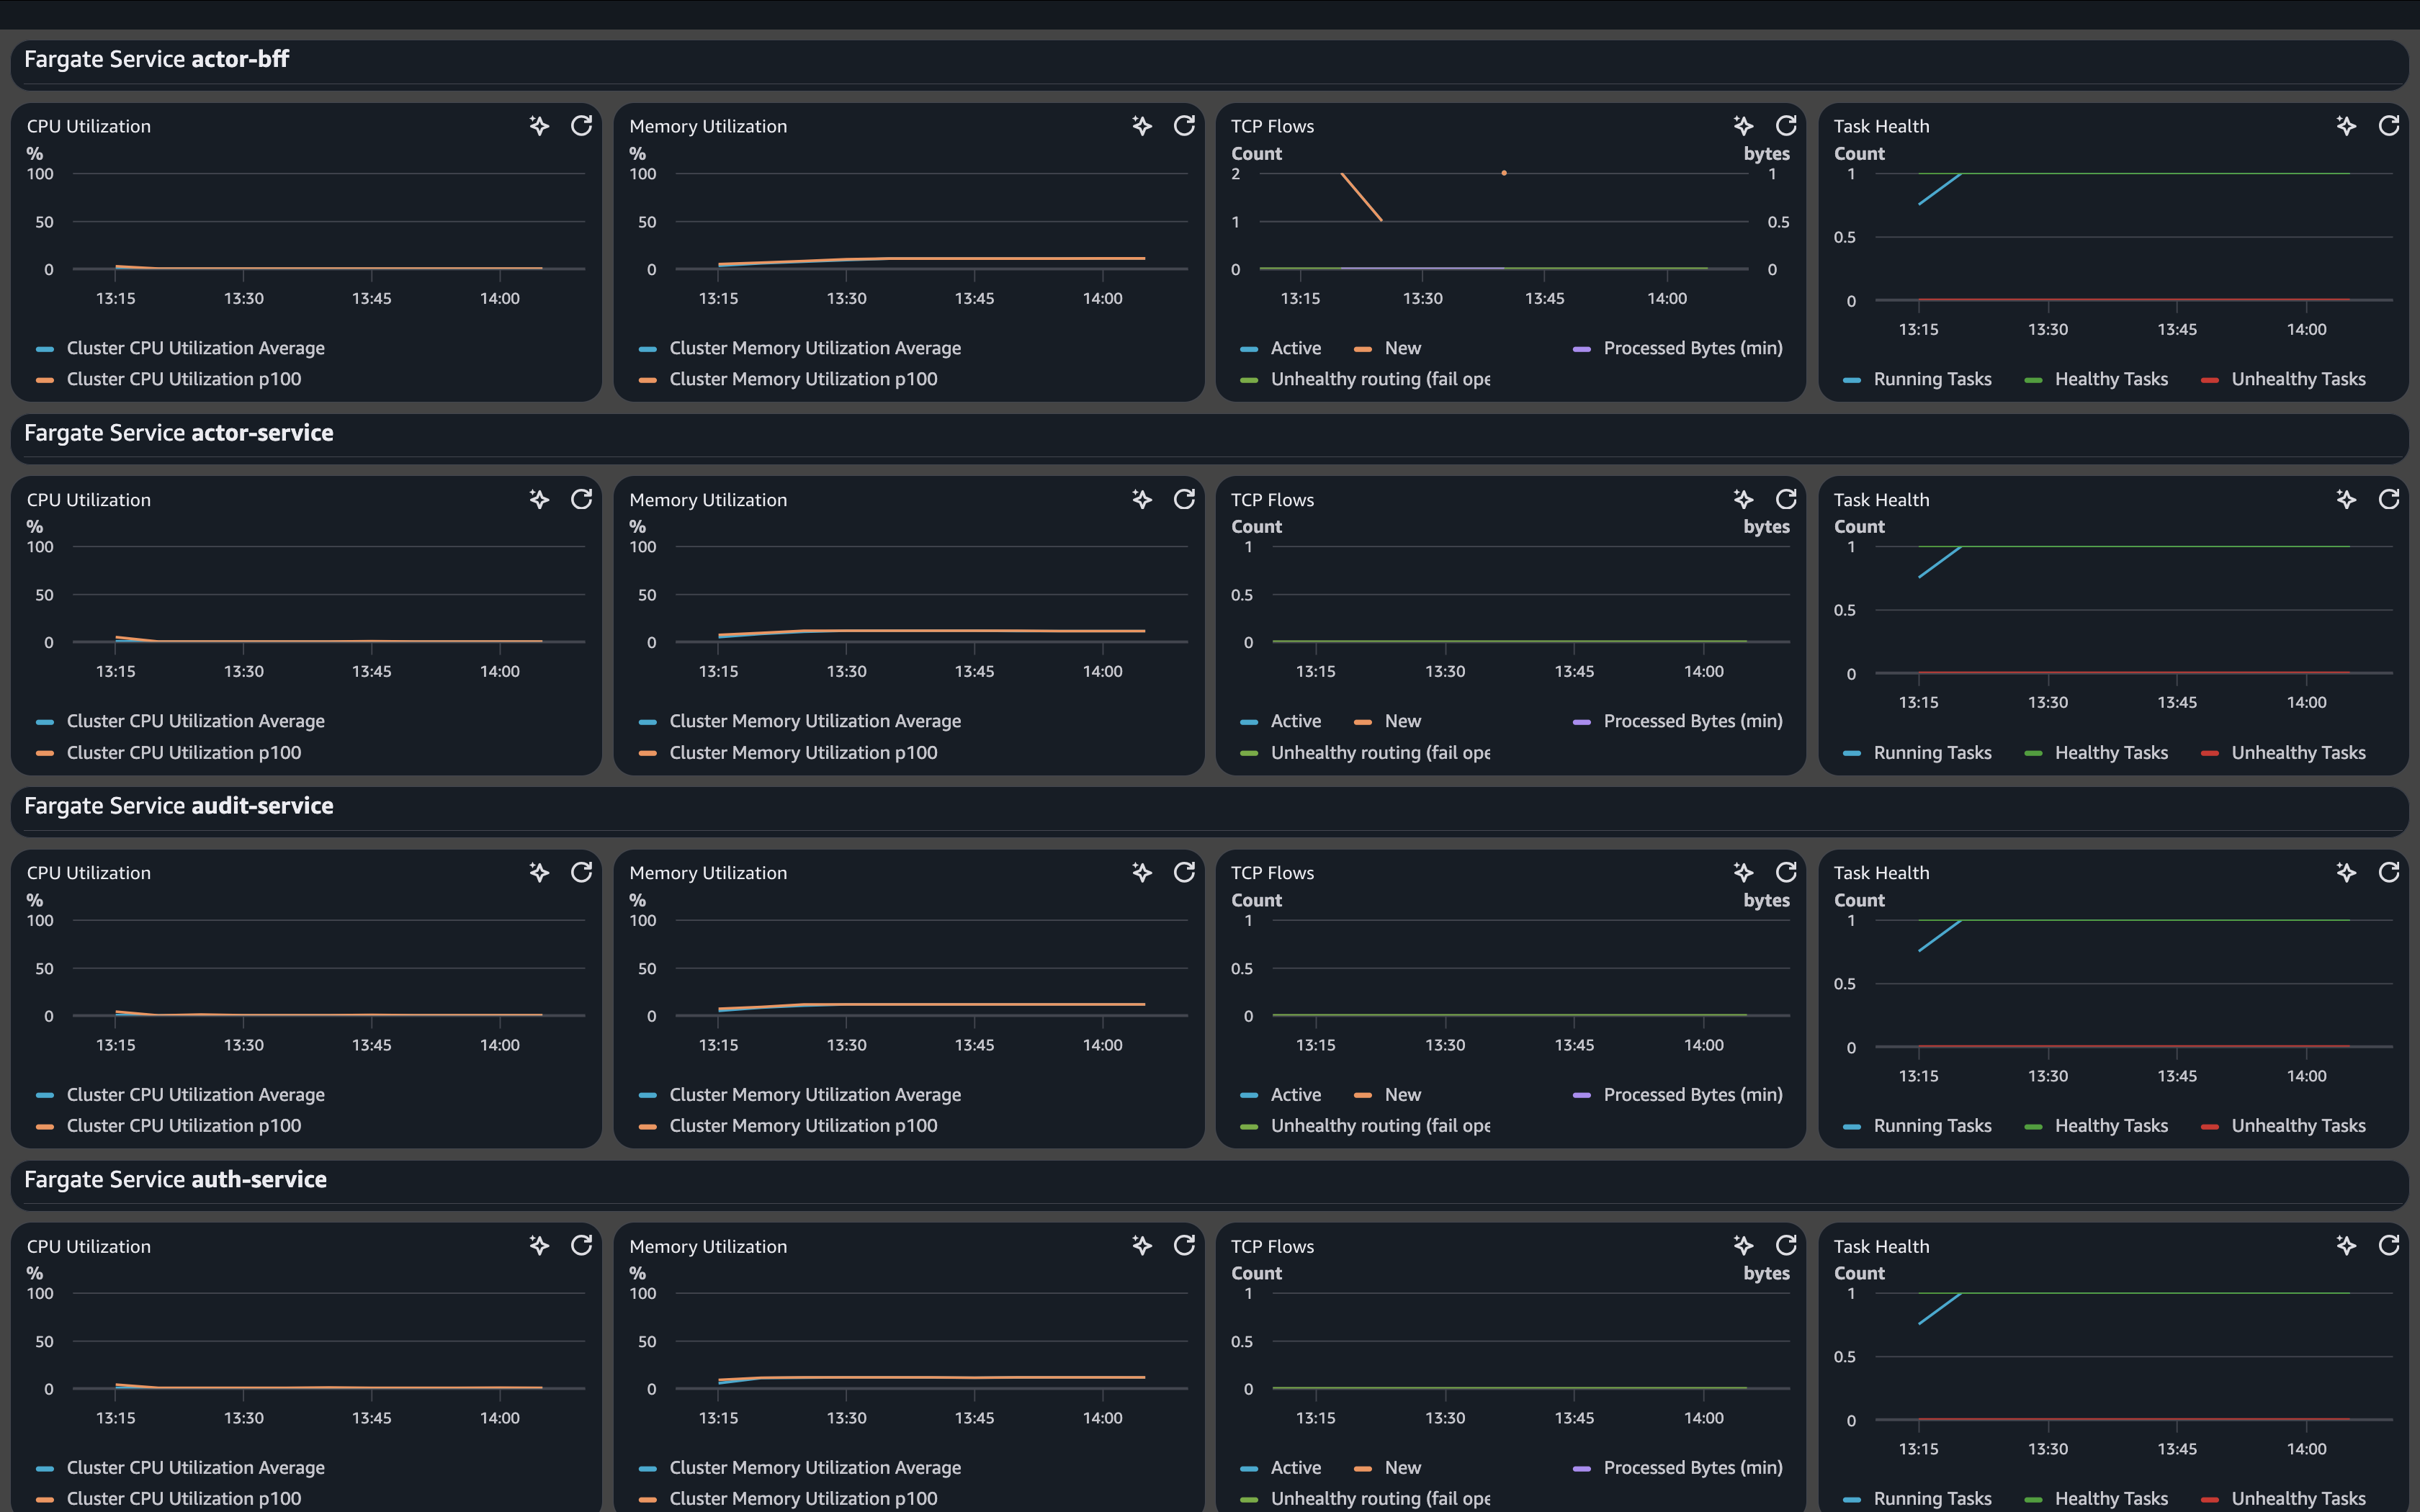
Runtime monitoring covers each deployed Fargate service and its associated load-balancer target group — the same services described in Health checks, but from the infrastructure perspective (target health counts, not dependency probe logic).
Intentionally out of scope
Forge focuses monitoring on Forge-provisioned, operator-actionable resources. The following are deliberately not covered by CloudWatch dashboards and alarms — either because AWS already manages availability, because another concern owns the signal, or because operators typically provide org-wide equivalents:
| Omitted area | Rationale |
|---|---|
| ECS control plane | AWS-managed service; runtime health is monitored through deployed services rather than ECS regional availability |
| VPC, NAT, and interface endpoints | AWS-managed HA boundary; low signal-to-noise for a product baseline |
| Observability stack (AMP / AMG) | Application observability backend — not infrastructure health |
| Governance evidence stack | Durable proof for investigations — not operational dashboards (Observability architecture) |
| Shared IAM and security groups | No standalone infra metrics; changes surface via governance evidence |
| Generic EC2 and account billing | Not part of the Fargate-first runtime model |
| Route 53 and ACM | Certificate renewal and DNS governance are typically handled through organisational operational processes rather than application-level CloudWatch alarms |
This is a baseline, not a landing zone. Mature operators extend coverage with AWS Config, GuardDuty, synthetic canaries, composite alarms, and org-wide observability — documented as common operator extensions in Observability architecture.
Infrastructure monitoring deploys with every cloud environment. Managed application observability has different defaults because it introduces additional infrastructure and cost. See Operations for deployment defaults.
Common operator extensions
Forge provisions CloudWatch alarms to SNS; routing and escalation are operator-owned:
| Extension | Complements |
|---|---|
| On-call integration | SNS → PagerDuty, Opsgenie, Slack, email |
| Alarm tuning | Threshold and evaluation-period adjustments |
| Composite and anomaly alarms | Reduce noise; detect subtle drift |
| Synthetic canaries | End-to-end probes beyond load-balancer health |
| Central ops account | Cross-account SNS fan-out for multi-env estates |
Governance evidence (CloudTrail, load-balancer access logs) answers attribution and proof questions — not “page me because CPU is high.” Keep alarm routing separate from evidence archives.
Further reading
- Observability architecture — four-concern model and how infrastructure monitoring relates to application observability and governance evidence
- Application telemetry — metrics, traces, and logs exported to AMP, X-Ray, and CloudWatch Logs
- Health checks — readiness probes used by load balancers
- ADR-0026: Observability backend strategy
- ADR-0027: Governance evidence architecture
- Using Amazon CloudWatch alarms — AWS Documentation
- AWS Well-Architected Framework — Reliability pillar — AWS Documentation
Updated 8 days ago